Analytics data is sent automatically by the Brightcove Players, including those provided by the Native Player SDKs. If you are not using a Brightcove Player to deliver Beacon videos, you need to instrument the player you are using to send the data to the Data Collector. See the Overview: Data Collection API topic for more details.
To view the Performance report, open the Analytics module and select Performance from the left side navigation. The report will display a graph showing total video views per day for the time period selected. The dropdown list can be used to select another metric:
- Video Views - The number of times a video started playing, recorded when the stream is started (does not include rewind or replay); it is not a measure of individual viewers; for videos with pre-roll ads, a view is not recorded until the video starts to play
- Video Impressions - Number of times a video was loaded and ready for interaction
-
Play Requests - The number of times playback was requested - play requests are generated by:
- the viewer initially clicking the play button
- the viewer pausing the video and clicking play to resume playback
- an autoplay event
- the viewer scrubbing or clicking on the playback timeline (which pausees and restarts the video automatically)
- Play Rate - The percentage of videos that were loaded that were actually played (video views / video impressions)
- Viewed Minutes - Number of minutes the video was watched
- Engagement Score - The average percent watched per video view (calculated by adding all the percentage watched divided by the number of video views)
- Daily Unique Viewers - Calculated using the IP address and user agent of viewers. Brightcove made the decision not to use a 3rd party cookie because cookies are increasingly being blocked by browsers. Daily Unique Viewers is available at the account or video level; this metric is not available when filtering by a video (or anything else). Brightcove also provides the ability to base unique viewers on the value you provide instead of their IP address. For more information, see the Analytics Event Tracking developer document.
- Video Bandwidth - Includes bandwidth for videos only. Note that bandwidth data is delayed by 3-5 days.
- Total Bandwidth - Includes bandwidth for videos, images and player loads. Note that bandwidth data is delayed by 3-5 days.
By default, the report will display performance data for all stream types. If your account is enabled for Brightcove Live, you can choose to view performance data for all videos, VOD assets or live assets. Click the Stream type pill to make a selection.

The report switcher below the chart can be used to quickly switch to another report.

The dropdown list to the right of the report switcher can be used to select a report dimension. The following dimensions are available with the Performance Report:
- Video
- Player
- Source of Traffic
- Display Domain
- Country
- Device
- Device Type
- Device OS
- Device Manufacturer
- Browser Type
- Day
Note that the available dimensions will change based upon the report that is selected. The bottom of the report has controls which let you select how many rows should be displayed and for navigating to other pages.
Compare to previous period
Selecting the Compare to previous period checkbox will add an overlay dashed line graph representing the data for the previous period.
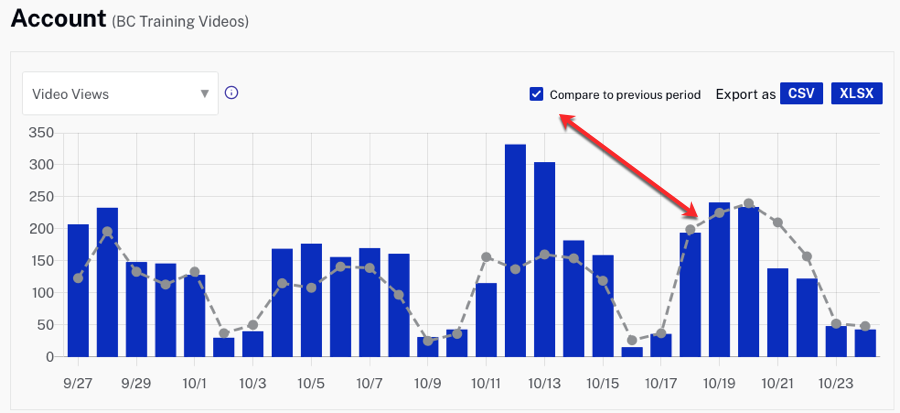
The previous period is based upon what is currently selected for the report date range. For example, if you select a date range of last 7 days, the previous period will be 2 weeks ago. When comparing trends over weeks, it is best to select date ranges that cover complete weeks. For example, if you select a date starting on a Monday, set the end date to a Sunday. If the start date is on a Friday, set the end date to a Thursday. You can also mouse over both the bars and dashed line to see the date and corresponding values.
Performance report details
The first column that appears in the body of the report will vary based upon the report dimension that is selected (video name, player name, country, device type, etc.). All reports will display the following data:
- Video Views - The number of times a video started playing, recorded when the stream is started (does not include rewind or replay); it is not a measure of individual viewers
- Video Impressions - The number of times the video was loaded into a player and ready for interaction
- Play Requests - The number of times playback was requested either by a user pressing the play button or an auto-play event
- Play Rate - The percentage of users that played the video after it was loaded (Video Views divided by Video Impressions)
- Viewed Minutes - Total number of minutes the video was viewed
- Engagement Score - The average percent watched per video view (calculated by adding all the percentage watched divided by the number of Video Views)
The Video and Day dimensions will also display the Daily Unique Viewers which is the average daily unique viewers for the time period selected. This is calculated using the IP address and user agent of viewers.
Traffic Sources
When viewing the Performance by Source of Traffic, possible traffic sources are:
- Referral - User followed a link to the video
- Direct - User typed the link directly or the referrer was not able to be determined
- Secure search - User logged in with a Google account, performed a search and clicked on a result (either paid or organic; search information is not included in this case)
- Organic search - User performed a search and clicked on a result to get to the video
- Paid search - User performed a search and clicked on a paid result to get to the video
Device Types
Several of the Performance reports allow viewing by device type. Possible device types are:
- Desktop - Includes desktop and laptop computers
- Tablet - Includes iPads, Android tablets, etc.
- Mobile - Mobile phones
- Connected TV/Game Console/Companion Device - Includes Smart TVs, set-top boxes and game consoles
- Other - For user-agents which are not mapped to any of the above
Device Operating Systems
Several of the Performance reports allow viewing by device operating system. Possible operating systems are:
- Android
- Bada
- iOS
- Linux
- OS X
- RIM
- Symbian
- Web OS
- Windows
- Other - for user-agents which are not mapped to any of the above
Device Manufacturers
Several of the Performance reports allow viewing by device operating system. Possible device manufacturers are:
- Apple
- Amazon
- ASUS
- Blackberry
- Fujitsu
- Huawei
- HTC
- Kyocera
- Lenovo
- LG
- Micromax
- Microsoft
- Nintendo
- Panasonic
- Roku
- Samsung
- Sharp
- Sony
- Vizio
- ZTE
- Other - When the device manufacturer can't be determined. Common cases of Other being reported include:
- Desktop browser user-agents don't indicate manufacturer
- The third-party Brightcove uses to identify the device doesn't have device details
Browser Types
Several of the Performance reports allow viewing by browser type. Possible browser types are:
- Chrome
- Edge
- Firefox
- Internet Explorer
- Opera
- Safari
- All Others - for user-agents which are not mapped to any of the above
Viewing video analytics
When the Video dimension is selected, a graph will display the number of video views per day for the time period selected. The body of the report lists the video name, video ID, duration and the performance details for each video.
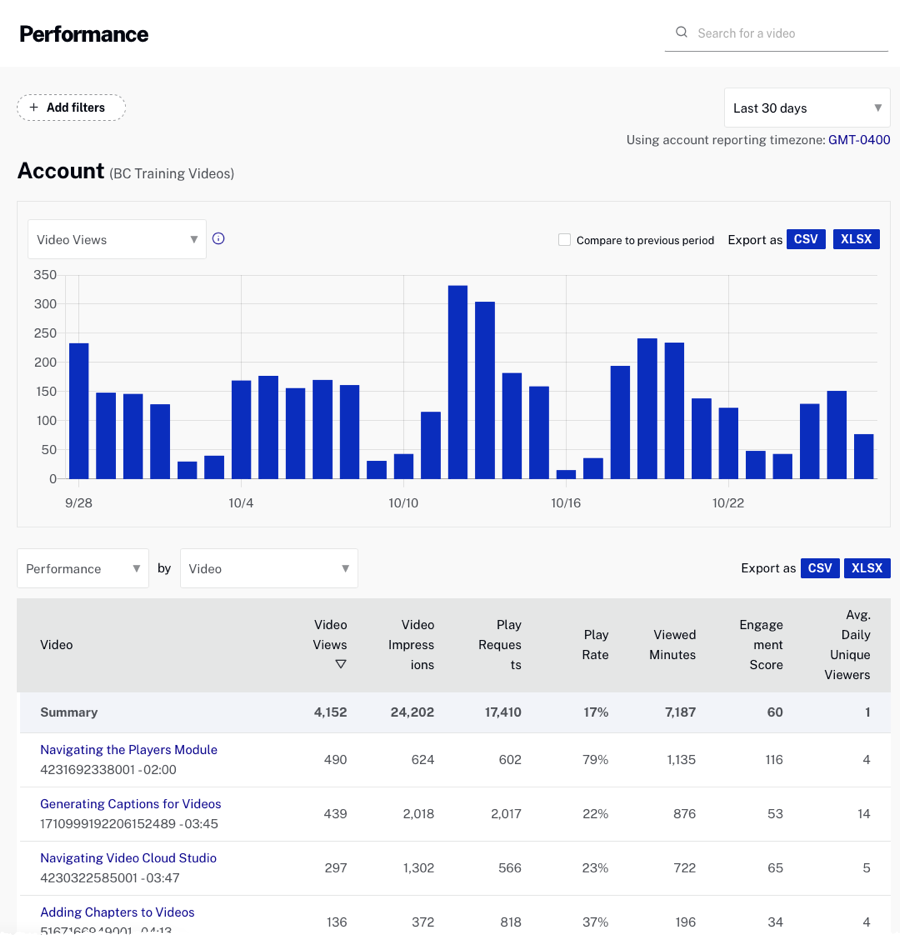
Clicking the link for any of the videos will display the performance for that video.
Viewing player analytics
When the Player dimension is selected, a graph will display the number of video views per day for the time period selected. The body of the report lists the performance details for each player.
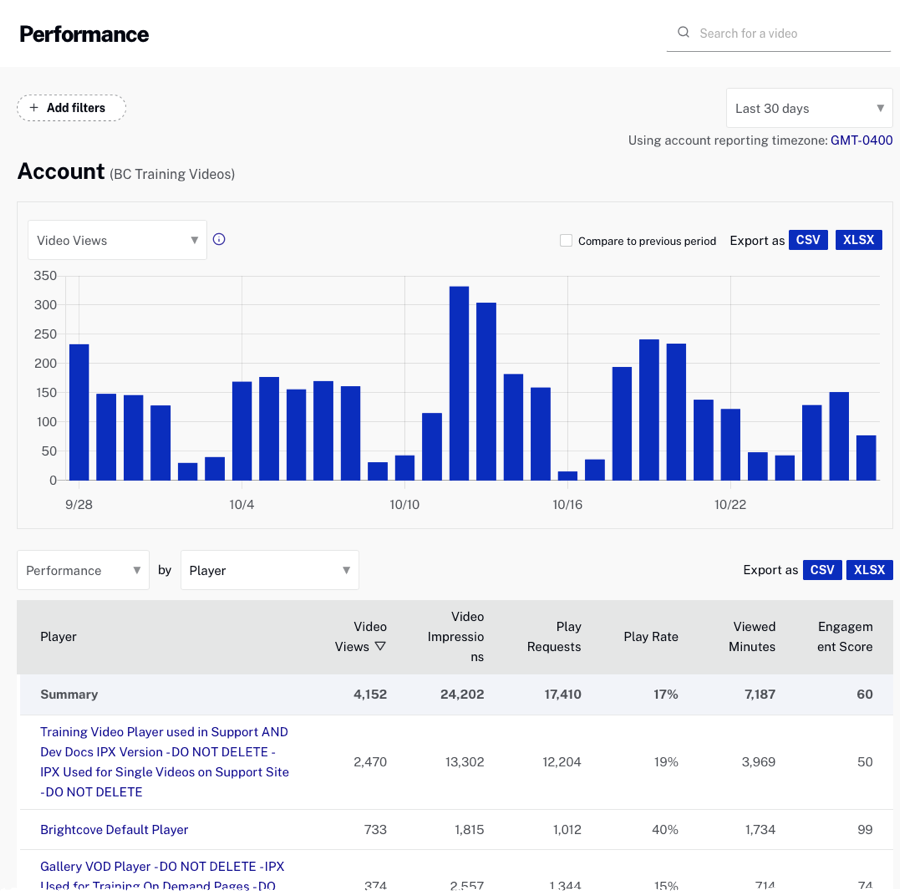
Clicking the link for any of the players will display the performance for that player.
Viewing source of traffic analytics
When the Source of Traffic dimension is selected, a graph will display the number of video views per day for the time period selected. The body of the report will display the performance data for each traffic source. Only categories which have data within the time period selected will be displayed.
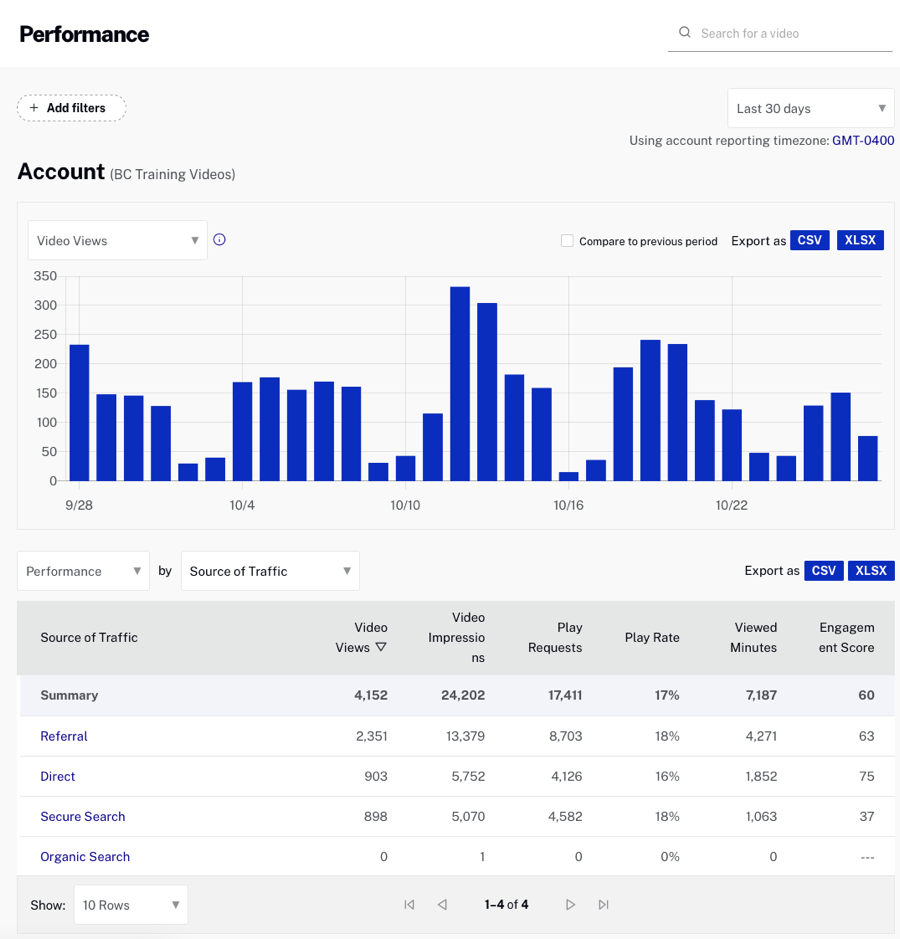
Clicking the link for any of the traffic sources will display the traffic source performance for the selected traffic source.
Viewing display domain analytics
When the Display Domain dimension is selected, a graph will display the number of video views per day for the time period selected. The body of the report will display the performance data for the display domains. The display domain is the domain the viewer was on when they watched a video.
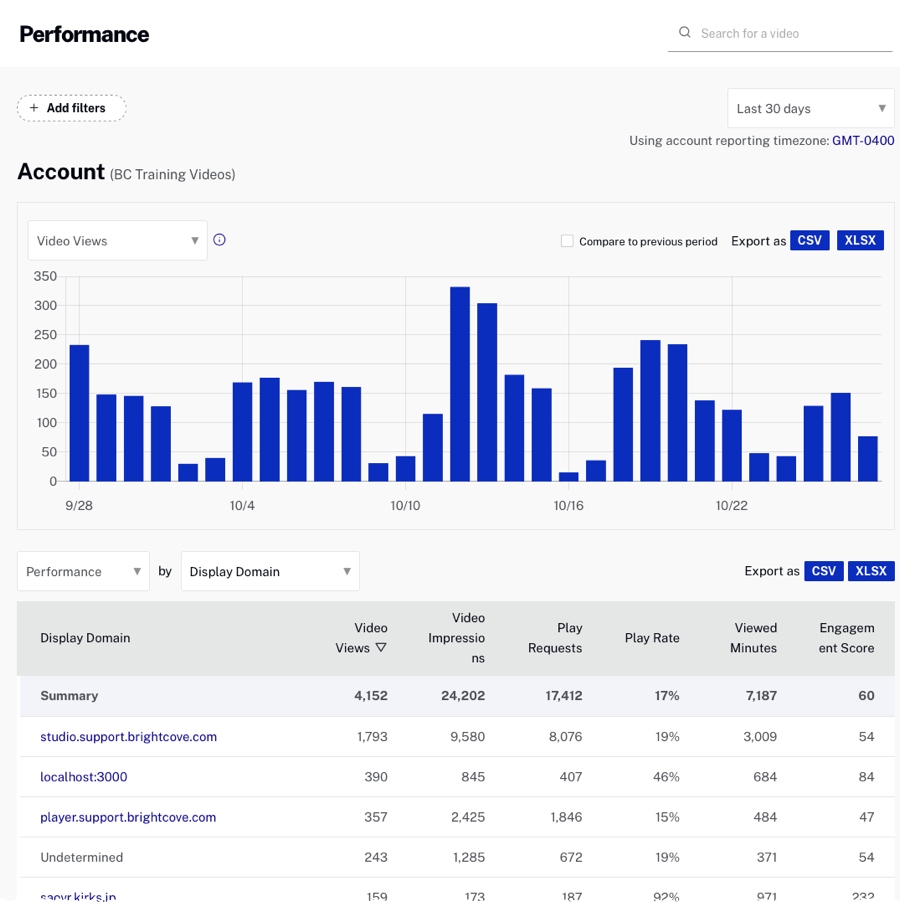
Clicking the link for any of the display domains will display the display URLs for the selected display domain.
Viewing country analytics
When the Country dimension is selected, a graph will display the number of video views per day for the time period selected. The body of the report will display the performance data for each country where videos were viewed. Only countries which have data within the time period selected will be displayed.
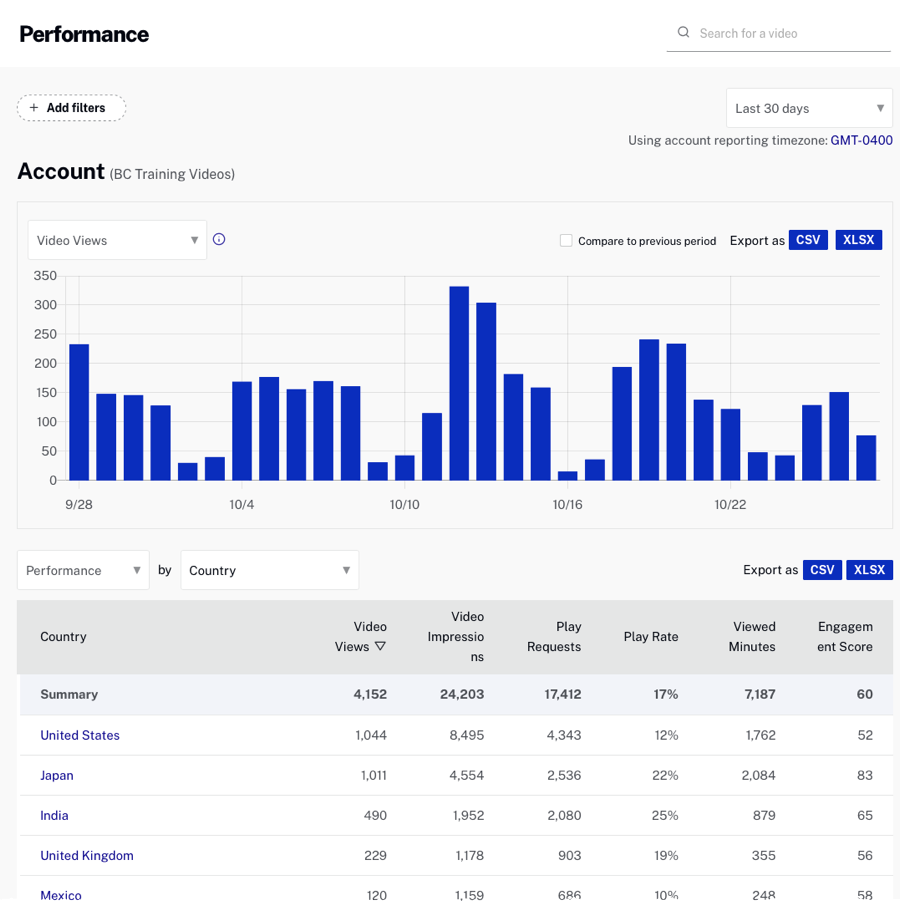
Clicking the link for any of the countries will display the performance by region or city for the selected country, if you are viewing analytics for the account, not an individual video.
Viewing device analytics
When the Device dimension is selected, a graph will display the number of video views per day for the time period selected. The body of the report will display the performance data for each Device Type - Device Operating System combination that was used to view a video. Only devices which have data within the time period selected will be displayed.
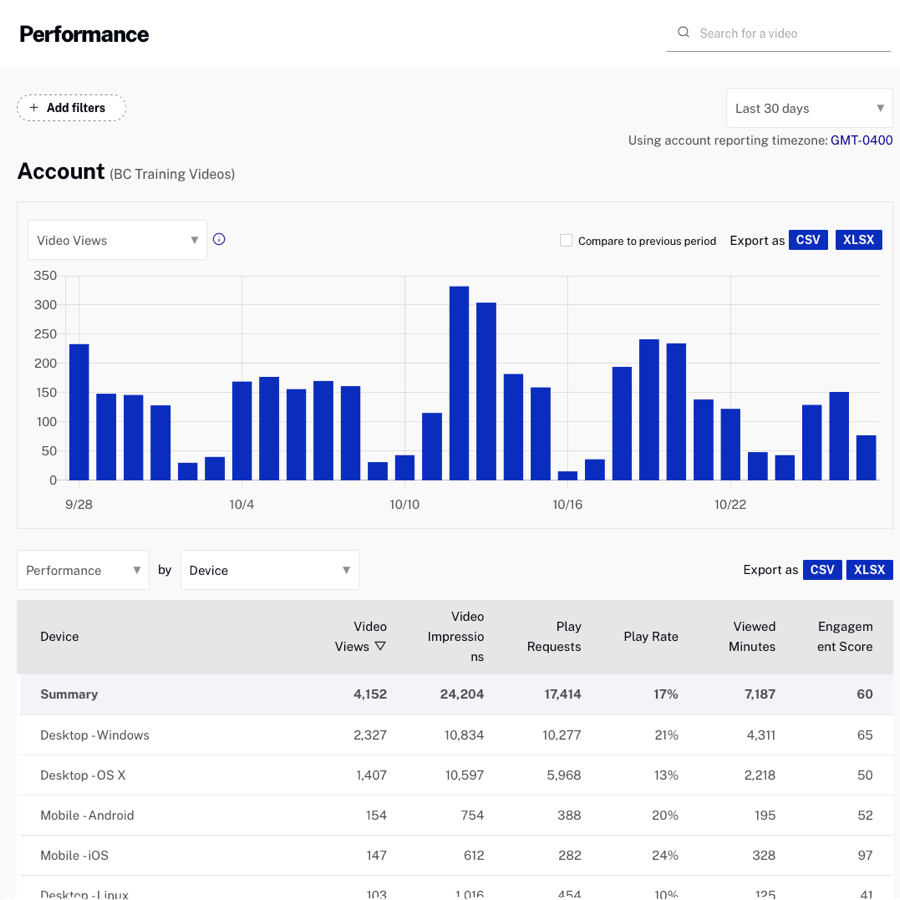
Clicking the link for any of the device types will display the performance by device operating system.
Viewing device type analytics
When the Device Type dimension is selected, a graph will display the number of video views per day for the time period selected. The body of the report will display the performance details by device type. Only categories which have data within the time period selected will be displayed.
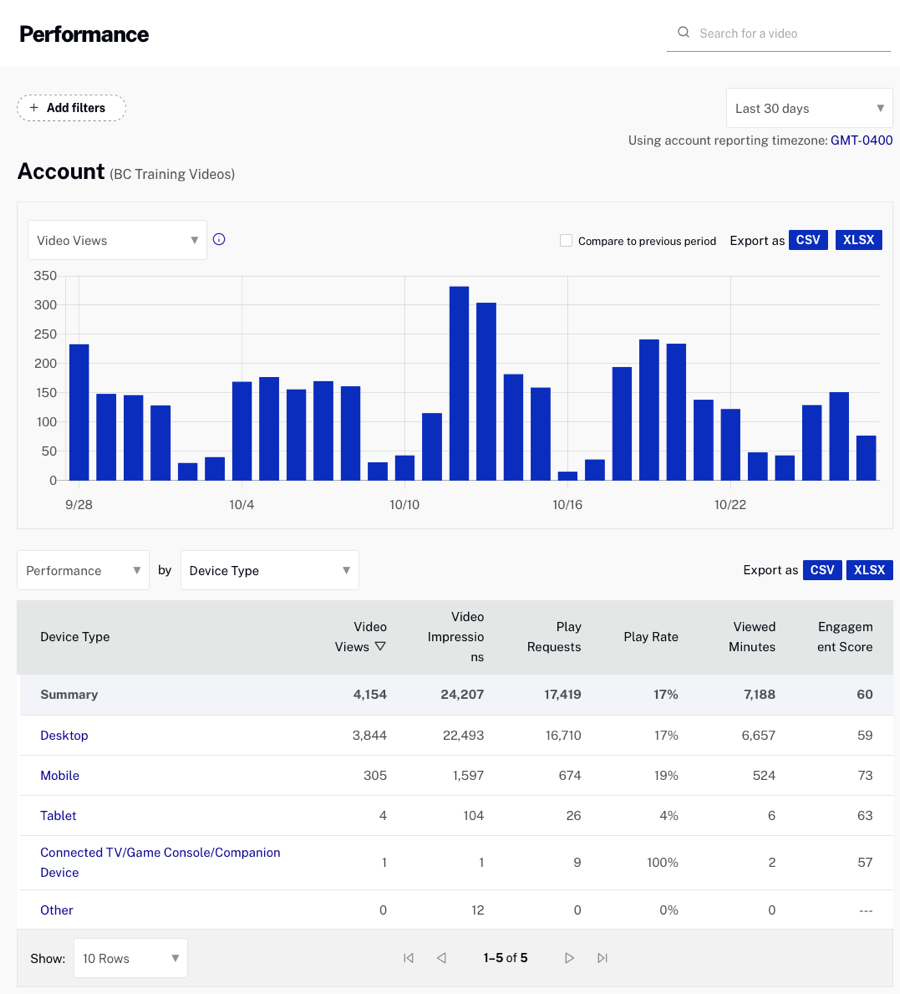
Clicking the link for any of the device types will display the performance by device operating system.
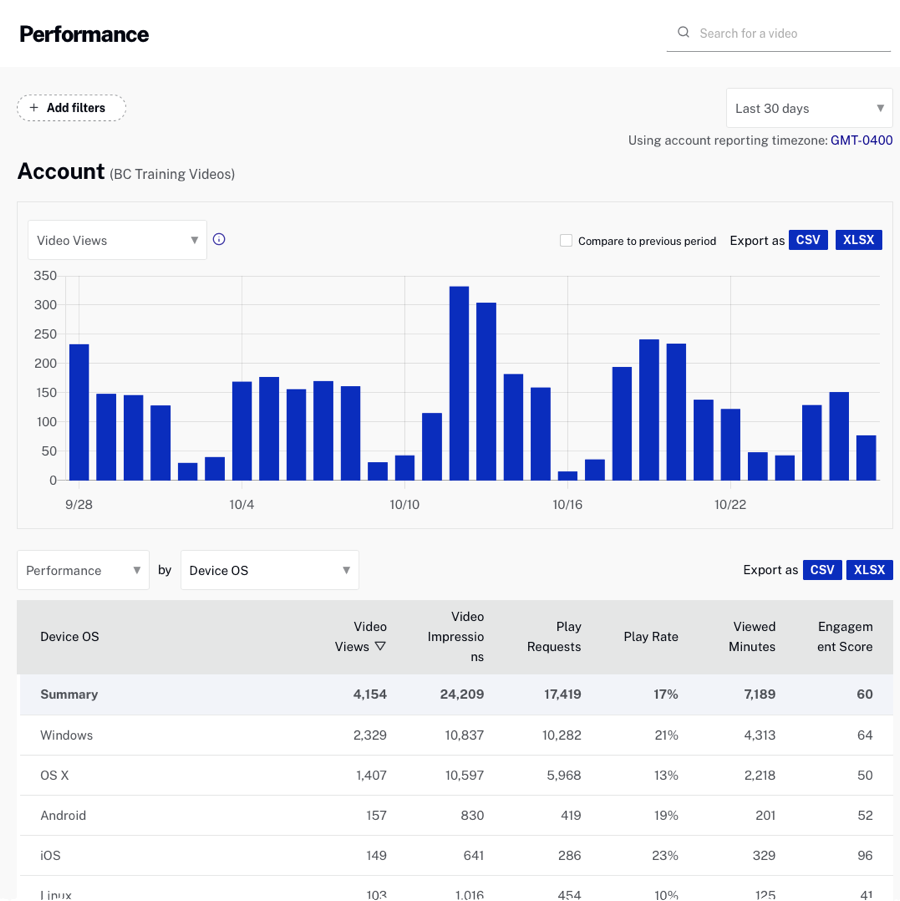
Viewing device OS analytics
When the Device OS dimension is selected, a graph will display the number of video views per day for the time period selected. The body of the report will display the performance data for each device operating system. Only categories which have data within the time period selected will be displayed.
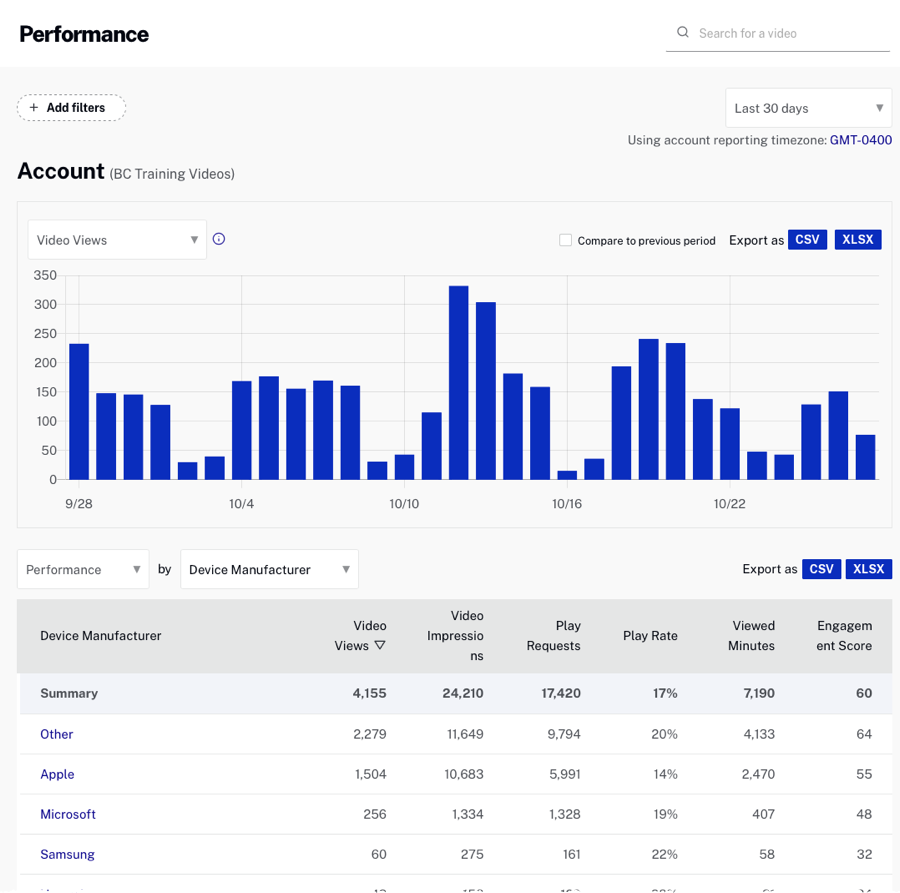
Viewing device manufacturer analytics
When the Device Manufacturer dimension is selected, a graph will display the number of video views per day for the time period selected. The body of the report will display the performance data for each device manufacturer. Only devices which have data within the time period selected will be displayed.
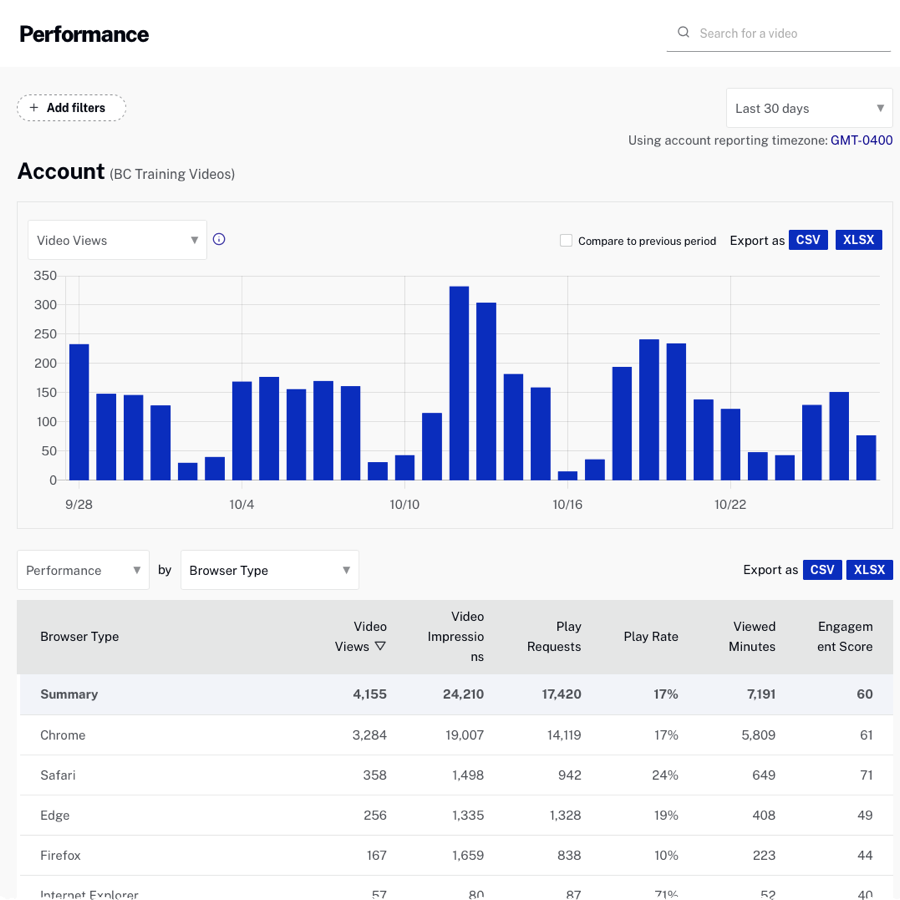
Viewing browser type analytics
When the Browser Type dimension is selected, a graph will display the number of video views per day for the time period selected. The body of the report will display the performance data for each browser type. Only browsers which have data within the time period selected will be displayed.
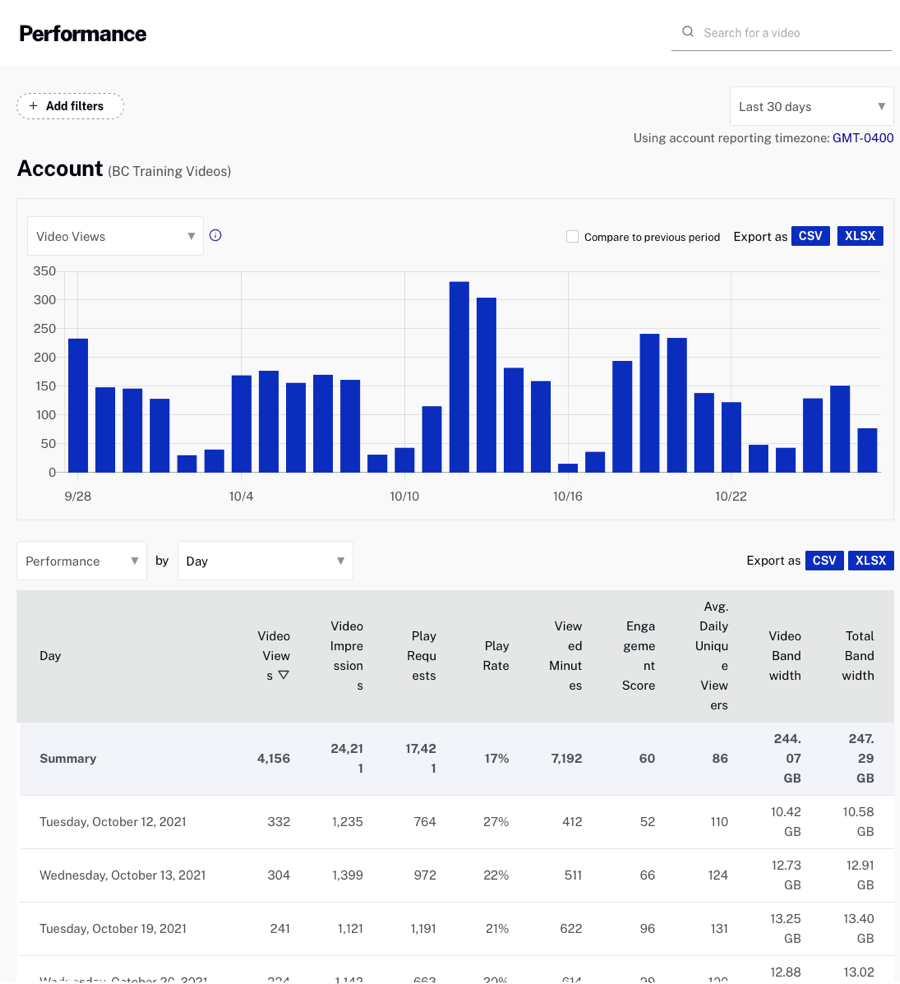
Viewing day analytics
When the Day dimension is selected, a graph will display the number of video views per day for the time period selected. The body of the report will display the performance data for each day. Only days which have data within the time period selected will be displayed.
Using filters
Filters can be used to limit the data that appears in the report. To add a filter, follow these steps.
- Click the + Add filters pill at the top of the report.
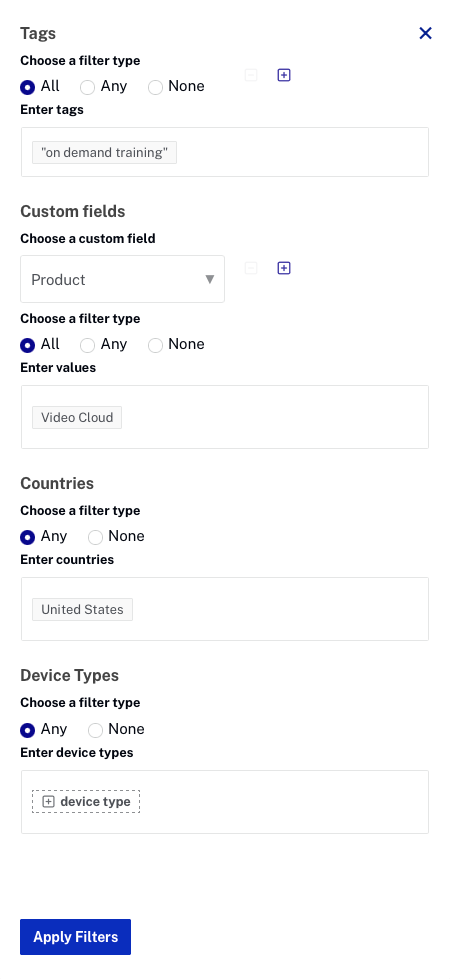
- The data can be filtered by tags, custom fields, countries and device types. Configure the filter criteria using the filter panel. The following example will apply the filter:
- Tag = on demand training AND
- Custom field Product = Video Cloud AND
- Countries = United States
- Click .
The applied filters will appear in pills at the top of the report. Each pill will display a filter type and up to two values. Up to three pills will be displayed.

Additional pills are collapsed into an overflow pill and, are displayed in a tooltip on hover.

To remove a filter, click a pill and clear the filter from the filter panel.
Notes on using filters
- Stream type is only available if Brightcove Live is enabled on the account
- The custom fields section will be disabled if the account is not enabled for custom fields
- Filters can be added/removed by using the plus / minus buttons to the right of the filter type
- Although filters appear to be applied, they are not applicable to all sections of the Analytics module
- Tags and custom field filters are not applied when you click on a specific video or player to view the performance details for the video or player (the only exception being Player by Video or Day dimensions)
- Engagement graph (graph at the top of the Engagement report page)
- Analytics data may take a bit longer to load when applying filters
- Filter type
- All - Must include all values
- Any - May include any values
- None - Must include none of the chosen values
Exporting report data
Report data can be downloaded as both comma separated values and Excel formats. Note that the export feature saves the data directly from an Analytics API call. The exported data is not manipulated the way the UI data is, and currently contains all of the underlying data in the report, not just the subset of fields the UI shows. Some of the differences between what is shown in the UI vs. the exported data:
- Different units (minutes vs seconds)
- Rounding of numbers
- The data export contains both the performance and engagement metrics regardless of where you are in the UI
- The Other/Third Party entry will be exported with no associated video ID or video name
Having all of the data in the original format from the API allows you to manipulate the data in ways other than what is provided in the UI.

The export buttons above the graph will export the graph data. The export buttons above the table will export the table data. Note that the reports support print-friendly style sheets so printing a report or saving to PDF will generate a printer-friendly page.

